%matplotlib inline
import matplotlib.pyplot as plt
import numpy as np
入门
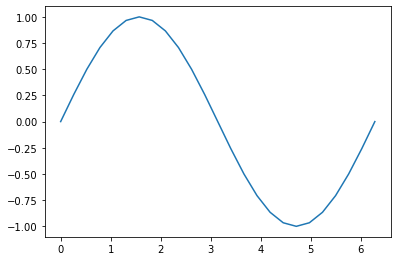
下面,我们用描点法来画正弦函数 $y = \sin{x}$ 一个周期内的图像。
首先,我们要生成一系列均匀的散点 x,并计算出对应的函数值 y:
x = np.linspace(0, 2*np.pi, num=25, endpoint=True)
y = np.sin(x)
然后直接调用 plt.plot 方法绘图即可:
plt.plot(x, y)
[<matplotlib.lines.Line2D at 0x18edab70a30>]

但是,我们的教程非常不推荐这种绘图方法,因为这种绘图方法只适用于简单图像的绘制,如果需要对图像的各个元素进行更细致化的设置是不行的。
用 Axes 对象绘图
首先,我们获取 Figure 对象。
fig = plt.figure()
<Figure size 432x288 with 0 Axes>
不过 Figure 对象只是一个空白的 Figure 窗口,它没有任何的坐标系可以绘制图像。因此,我们需要在 Figure 对象中添加 Axes 对象:
ax = fig.add_axes([0.1, 0.1, 0.8, 0.8])
传入的四元组参数表示绘图区域 Axes 的横纵坐标、宽度和高度,都是 $[0, 1]$ 之间的浮点数。
这样,当我们显示绘图窗口时,会发现是一张有坐标系的白纸:
fig
下面,我们调用 Axes 对象的 plot 绘图方法:
sin_line = ax.plot(x, y)
Figure 对象是整个绘图窗口,它不能画图。只有控制整个绘图区域的 Axes 对象才能画图。
现在来看看绘图窗口,会发现已经有图像显示了:
fig
ax.clear()
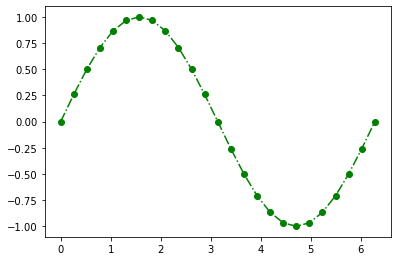
美化图像
我们可以用一些简单的参数美化图像,例如设置线条颜色为绿色,线条样式为点划线,并用实心点标注。
sin_line = ax.plot(x, y, 'go-.')
fig
ax.clear()
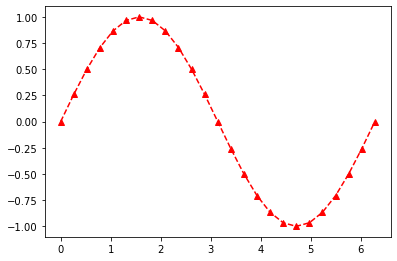
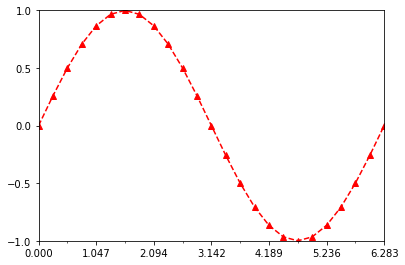
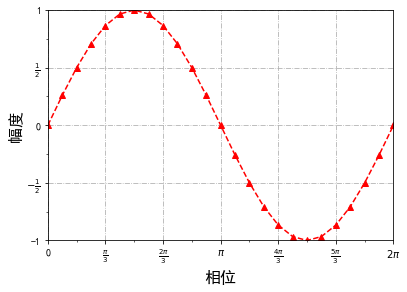
颜色、线条样式和标注样式可以分别设置:
sin_line = ax.plot(x, y, color='r', ls='--', marker='^')
fig
坐标轴设置
坐标轴范围
坐标轴范围即定义域,也就是 x 的取值范围;以及值域,也就是 y 的取值范围。
我们绘制的是正弦函数一个周期内的图像,因此可以设置其横轴的取值范围为 $[0, 2 \pi]$。
ax.set_xlim(0, 2*np.pi)
(0.0, 6.283185307179586)
fig
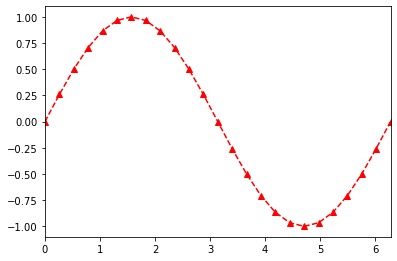
也可以设置其值域为 $[-1, 1]$。
ax.set_ylim(-1, 1)
(-1.0, 1.0)
fig
坐标轴刻度
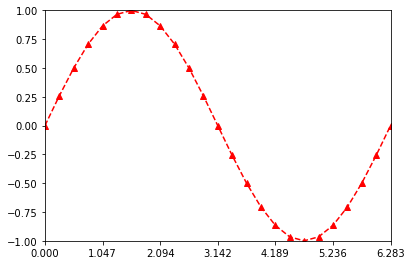
三角函数在 $\pi$ 的有理数倍处往往可以取到特殊值,而绘图时默认横轴的刻度是整数,我们可以进行如下调整:
xticks = np.linspace(0, 2*np.pi, num=7)
ax.set_xticks(xticks)
[<matplotlib.axis.XTick at 0x18edb3363d0>,
 <matplotlib.axis.XTick at 0x18edb336520>,
 <matplotlib.axis.XTick at 0x18edb351220>,
 <matplotlib.axis.XTick at 0x18edb34b2b0>,
 <matplotlib.axis.XTick at 0x18edb3212b0>,
 <matplotlib.axis.XTick at 0x18edb321130>,
 <matplotlib.axis.XTick at 0x18edb344700>]
fig
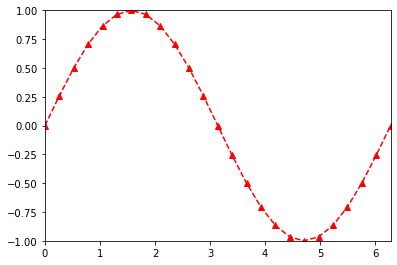
同理,纵轴的刻度也可以进行类似的调整:
yticks = np.linspace(-1, 1, num=5)
ax.set_yticks(yticks)
[<matplotlib.axis.YTick at 0x18edb310eb0>,
 <matplotlib.axis.YTick at 0x18edb310df0>,
 <matplotlib.axis.YTick at 0x18edb33bc70>,
 <matplotlib.axis.YTick at 0x18edb2e3310>,
 <matplotlib.axis.YTick at 0x18edb2e33a0>]
fig

坐标轴子刻度
坐标轴子刻度不能用标签或者值进行标注。访问坐标轴子刻度需要通过 Axis 坐标轴对象。MultipleLocator 类按照指定间隔设定刻度 tick。
miloc = plt.MultipleLocator(np.pi/6)
ax.xaxis.set_minor_locator(miloc)
fig
miloc = plt.MultipleLocator(1/4)
ax.yaxis.set_minor_locator(miloc)
fig

坐标轴刻度标签
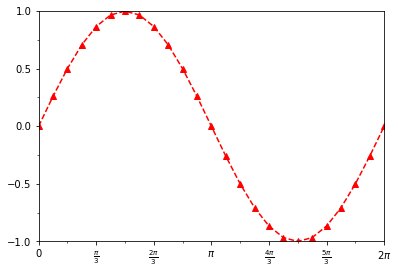
我们发现,前面一小节设置的横轴刻度还不能够满足我们的需求。如果刻度线下面显示刻度值是含有 $\pi$ 的无理数就更完美了。因此,需要设置坐标轴刻度标签。
xticklabels = [0, r'$\frac {\pi} {3}$', r'$\frac {2 \pi} {3}$', r'$\pi$',
               r'$\frac {4 \pi} {3}$', r'$\frac {5 \pi} {3}$', r'$2 \pi$']
ax.set_xticklabels(xticklabels)
[Text(0.0, 0, '0'),
 Text(1.0471975511965976, 0, '$\\frac {\\pi} {3}$'),
 Text(2.0943951023931953, 0, '$\\frac {2 \\pi} {3}$'),
 Text(3.141592653589793, 0, '$\\pi$'),
 Text(4.1887902047863905, 0, '$\\frac {4 \\pi} {3}$'),
 Text(5.235987755982988, 0, '$\\frac {5 \\pi} {3}$'),
 Text(6.283185307179586, 0, '$2 \\pi$')]
要注意的是,如果需要渲染 LaTeX 公式,需要在字符串首尾添加 $ 符。而且,由于 LaTeX 代码涉及 \ 转义符,而 Python 字符串中也有类似语法,故字符串前需要加上 r 或者使用双反斜杠 \\。
fig
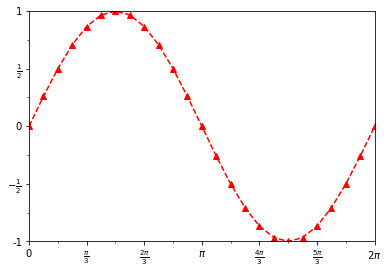
同理,纵轴的标签也可以这样设置:
yticklabels = ['-1', r'$- \frac {1} {2}$', '0', r'$\frac {1} {2}$', '1']
ax.set_yticklabels(yticklabels)
[Text(0, -1.0, '-1'),
 Text(0, -0.5, '$- \\frac {1} {2}$'),
 Text(0, 0.0, '0'),
 Text(0, 0.5, '$\\frac {1} {2}$'),
 Text(0, 1.0, '1')]
fig
坐标轴标题
坐标轴的标题同样也可以设置,并且支持 LaTeX,本小节不再赘述。
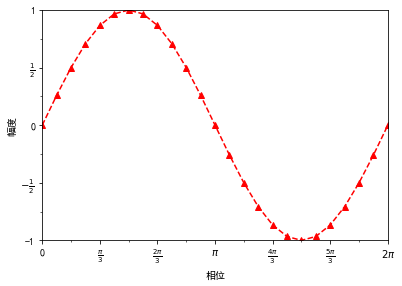
有些时候,坐标轴标题需要中文显示,而如果采用默认设置就会出现乱码。因此,需要进行如下设置:
from pylab import mpl
mpl.rcParams['font.sans-serif'] = ['SimHei']
现在,我们添加横纵坐标轴标题:
ax.set_xlabel('相位')
ax.set_ylabel('幅度')
Text(3.200000000000003, 0.5, '幅度')
fig
标题字体的大小也可以设置:
ax.set_xlabel('相位', fontsize=16)
ax.set_ylabel('幅度', fontsize=16)
Text(16.403125000000003, 0.5, '幅度')
fig

网格线
Axes 对象的 grid 方法可以添加网格线。
ax.grid()
fig

ax.grid(None)
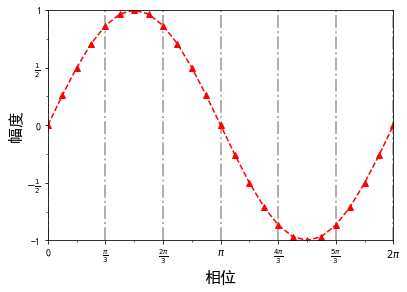
可以设置网格线的样式:
ax.grid(ls='-.')
fig
ax.grid(None)
可以只设置一个轴显示网格线:
ax.grid(axis='x')
fig

ax.grid(None)
设置网格线的粗细:
ax.grid(linewidth=2)
fig
图例
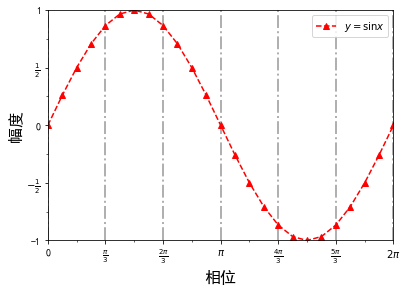
添加图例首先需要设置图像的 label 参数。我们首先要找到表示正弦曲线的 Line2D 对象:
sin_line?
[1;31mType:[0m list
[1;31mString form:[0m [<matplotlib.lines.Line2D object at 0x0000018EDB35B5B0>]
[1;31mLength:[0m 1
[1;31mDocstring:[0m
Built-in mutable sequence.
If no argument is given, the constructor creates a new empty list.
The argument must be an iterable if specified.
sin_line[0].set_label(r'$y = \sin{x}$')
loc 用于确定图例的位置,upper right 表示图例的显示位置为右上角。其他方位以此类推。
ax.legend(loc='upper right')
<matplotlib.legend.Legend at 0x18edb5ad280>
fig
ax.legend_.remove()
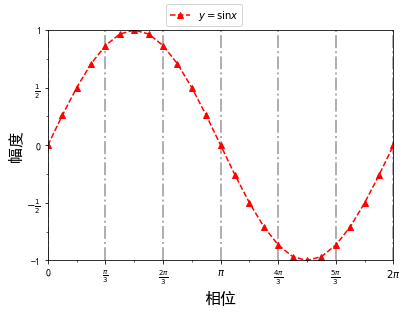
如果不希望图例显示在绘图区域,则需要通过 Figure 对象,将图例绘制在窗口内。
fig.legend(loc='upper center')
<matplotlib.legend.Legend at 0x18edb2e30d0>
fig
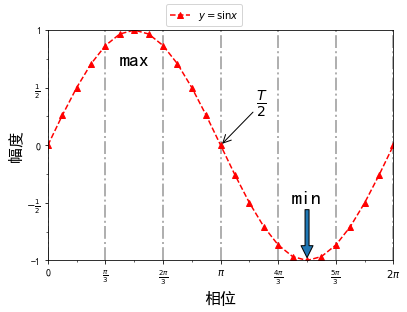
注解
在 Matplotlib 中,我们可以使用 annotate 方法来创建一个注解。
ax.annotate(
    text='max',
    fontsize=20,
    xy=(np.pi/2, 1),
    xytext=(np.pi/2, 0.7),
    horizontalalignment='center'
)
fig
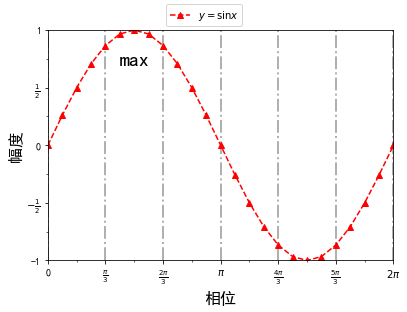
其中,参数 text 表示注解的文本内容,参数 xy 表示被注解的点的坐标,参数 xytext 表示注解的文本框的坐标。
我们还可以创建带有箭头的注解,这需要用到 arrowprops 参数。默认情况下,该参数取空值 None。如果需要绘制箭头,则需要传入指定格式的字典。
ax.annotate(
    text='min',
    fontsize=20,
    xy=(np.pi*3/2, -1),
    xytext=(np.pi*3/2, -0.5),
    horizontalalignment='center',
    arrowprops=dict(shrink=0.05)
)
fig
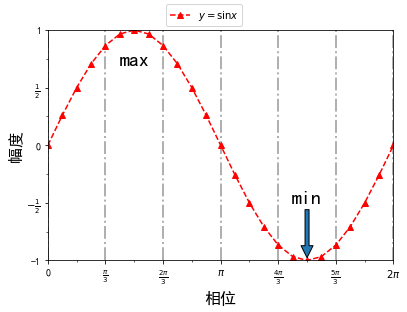
箭头参数主要包括:
width箭头宽度headwidth箭头头部宽度headlength箭头头部长度shrink箭头两端收缩的百分比
我们也可以采用内置的模板直接绘制,即指定 arrowstyle 参数。这个时候,不能手动设置箭头参数。
ax.annotate(
    text=r'$\frac {T} {2}$',
    fontsize=20,
    xy=(np.pi, 0),
    xytext=(4, 0.5),
    horizontalalignment='right',
    verticalalignment='top',
    arrowprops=dict(arrowstyle='->')
)
fig