线条样式
matplotlib 中一般通过 linestyle 或 ls 参数来设置线条样式,主要包括以下几种:
| 参数 | 说明 |
|---|---|
- 或 solid |
实线 |
-- 或 dashed |
虚线 |
-. 或 dashdot |
点划线 |
: 或 dotted |
点线 |
None 或 ‘ ’ 或 ‘’ |
不绘制线条 |
标记样式
matplotlib 中一般通过 marker 参数来设置标记样式,主要包括以下几种:
| 参数 | 说明 |
|---|---|
o |
圆圈 |
. |
点 |
d 和 D |
菱形 |
s |
正方形 |
h 和 H |
六边形 |
* |
星号 |
_ |
水平线 |
^ v < > |
上下左右三角形 |
8 |
八边形 |
p |
五边形 |
, |
像素 |
+ |
加号 |
\ |
竖线 |
x |
叉号 |
颜色
matplotlib 中一般通过 color 或 c 参数来设置标记样式,主要包括以下几种:
| 参数 | 说明 |
|---|---|
blue b |
蓝色 |
green g |
绿色 |
red r |
红色 |
yellow y |
黄色 |
cyan-blue c |
青色 |
black k |
黑色 |
magenta m |
洋红色 |
white w |
白色 |
如果以上的颜色不够用,需要自定义颜色,可以使用下面两种方法:
- 使用 HTML 十六进制颜色字符串,例如
#0F0F0F - 使用一个三元归一化的元组,例如
(0.3, 0.4, 0.5)
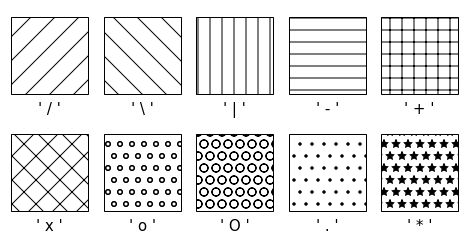
填充样式
import matplotlib.pyplot as plt
from matplotlib.patches import Rectangle
matplotlib 中一般通过 hatch 参数来设置条形图的填充样式。以下是一些简单的填充样式:
fig, axs = plt.subplots(2, 5, constrained_layout=True, figsize=(6.4, 3.2))

hatches = ['/', '\\', '|', '-', '+', 'x', 'o', 'O', '.', '*']


def hatches_plot(ax, h):
    ax.add_patch(Rectangle((0, 0), 2, 2, fill=False, hatch=h))
    ax.text(1, -0.5, f"' {h} '", size=15, ha="center")
    ax.axis('equal')
    ax.axis('off')

for ax, h in zip(axs.flat, hatches):
    hatches_plot(ax, h)
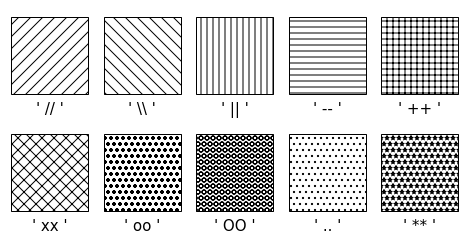
如果将参数值重复一遍,则会得到更密集的效果:
fig, axs = plt.subplots(2, 5, constrained_layout=True, figsize=(6.4, 3.2))

hatches = ['//', '\\\\', '||', '--', '++', 'xx', 'oo', 'OO', '..', '**']

for ax, h in zip(axs.flat, hatches):
    hatches_plot(ax, h)
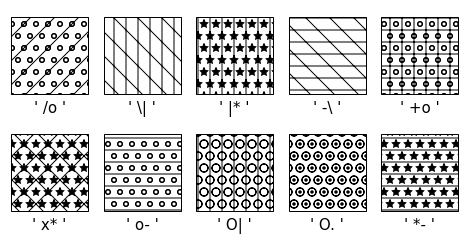
参数字符串也可以混合使用:
fig, axs = plt.subplots(2, 5, constrained_layout=True, figsize=(6.4, 3.2))

hatches = ['/o', '\|', '|*', '-\\', '+o', 'x*', 'o-', 'O|', 'O.', '*-']

for ax, h in zip(axs.flat, hatches):
    hatches_plot(ax, h)