
对数障碍函数与中心路径
我们的目标是把带不等式约束的问题近似地改写为可以用 Newton 方法求解的等式约束问题。第一步是把不等式约束隐式地并入目标函数,把原问题改写为
其中
该问题没有不等式约束,但其目标函数一般不可微,因此不能应用 Newton 方法。
对数障碍
障碍方法的基本思想是用函数
近似示性函数
把上式代入问题中,得到近似问题
其目标是凸的(因为
称为问题的对数障碍(logarithmic barrier)或 log 障碍(log barrier),其定义域是严格满足不等式约束的点集。无论正参数
当然,上述问题只是原问题的近似,于是立刻产生一个问题:(近似问题的) 解能在多大程度上近似原问题的解?直觉以及我们很快会证实的结论是:参数
为后面引用,注意对数障碍函数
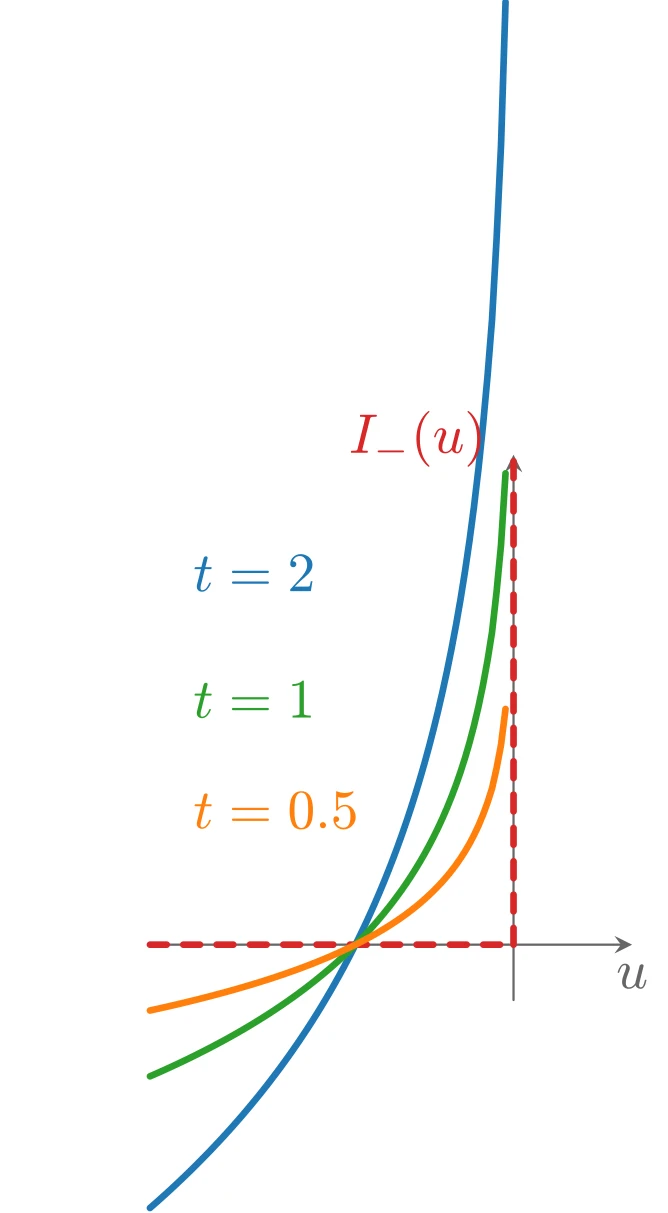
上图由下面的 TikZ 代码编译而来:
  \definecolor{cblue}{RGB}{31,119,180}
  \definecolor{cred}{RGB}{214,39,40}
  \definecolor{cgreen}{RGB}{44,160,44}
  \definecolor{corange}{RGB}{255,127,14}
  \definecolor{cpurple}{RGB}{148,103,189}
  \definecolor{cbrown}{RGB}{140,86,75}
  \definecolor{cpink}{RGB}{227,119,194}
  \definecolor{cgray}{RGB}{127,127,127}
\begin{tikzpicture}[x=1cm,y=1cm,>=stealth,line cap=round,line join=round]
  \draw[->,color=black!60] (-2.3,0) -- (0.75,0) node[below] {$u$};
  \draw[->,color=black!60] (0,-0.35) -- (0,3.1) node[left] {};
  \draw[cred,very thick,dashed] (-2.3,0) -- (0,0);
  \draw[cred,very thick,dashed] (0,0) -- (0,3.1);
  \draw[cblue,very thick,domain=-2.3:-0.05,samples=80] plot (\x,{-2*ln(-\x)});
  \draw[cgreen,very thick,domain=-2.3:-0.05,samples=80] plot (\x,{-ln(-\x)});
  \draw[corange,very thick,domain=-2.3:-0.05,samples=80] plot (\x,{-0.5*ln(-\x)});
  \node[anchor=west,color=corange] at (-2.15,0.85) {$t=0.5$};
  \node[anchor=west,color=cgreen] at (-2.15,1.55) {$t=1$};
  \node[anchor=west,color=cblue] at (-2.15,2.35) {$t=2$};
  \node[anchor=south east,color=cred] at (-0.05,2.9) {$I_{-}(u)$};
\end{tikzpicture}
中心路径
下面更详细地考虑近似问题。把目标函数乘以
假设该问题可以用 Newton 方法求解,特别地,对每个
且存在
例子:不等式形式线性规划
不等式形式 LP
的对数障碍函数为
其中
其中
它可以给出一个简单的几何解释:在中心路径上的点
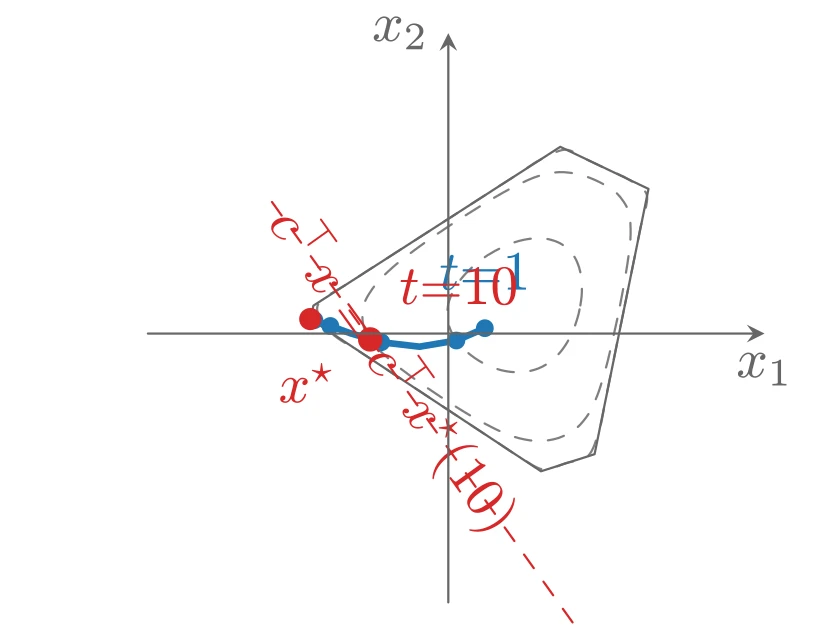
上图由下面的 TikZ 代码编译而来:
  \definecolor{cblue}{RGB}{31,119,180}
  \definecolor{cred}{RGB}{214,39,40}
  \definecolor{cgreen}{RGB}{44,160,44}
  \definecolor{corange}{RGB}{255,127,14}
  \definecolor{cpurple}{RGB}{148,103,189}
  \definecolor{cbrown}{RGB}{140,86,75}
  \definecolor{cpink}{RGB}{227,119,194}
  \definecolor{cgray}{RGB}{127,127,127}
\begin{tikzpicture}[x=1cm,y=1cm,>=stealth,line cap=round,line join=round]
  \draw[cgray,dashed] plot [smooth,tension=0.55] coordinates {(0.835,0.178) (0.843,0.234) (0.845,0.293) (0.841,0.356) (0.827,0.419) (0.801,0.480) (0.759,0.533) (0.705,0.572) (0.642,0.595) (0.576,0.603) (0.512,0.599) (0.452,0.587) (0.395,0.569) (0.343,0.547) (0.294,0.522) (0.248,0.495) (0.204,0.464) (0.162,0.429) (0.121,0.391) (0.082,0.347) (0.046,0.297) (0.017,0.240) (-0.002,0.178) (-0.006,0.112) (0.005,0.047) (0.032,-0.014) (0.070,-0.067) (0.115,-0.114) (0.165,-0.153) (0.218,-0.186) (0.274,-0.212) (0.332,-0.231) (0.391,-0.242) (0.452,-0.245) (0.511,-0.238) (0.569,-0.221) (0.622,-0.194) (0.668,-0.159) (0.708,-0.118) (0.741,-0.073) (0.768,-0.026) (0.791,0.023) (0.809,0.073) (0.824,0.124) (0.835,0.178)};
  \draw[cgray,dashed] plot [smooth,tension=0.55] coordinates {(1.086,0.178) (1.104,0.272) (1.122,0.375) (1.140,0.492) (1.153,0.629) (1.140,0.774) (1.066,0.887) (0.954,0.959) (0.830,1.006) (0.699,1.021) (0.569,0.996) (0.452,0.947) (0.349,0.893) (0.257,0.840) (0.173,0.788) (0.092,0.737) (0.012,0.685) (-0.070,0.630) (-0.157,0.569) (-0.252,0.499) (-0.356,0.415) (-0.461,0.309) (-0.536,0.178) (-0.533,0.036) (-0.452,-0.087) (-0.346,-0.186) (-0.241,-0.267) (-0.143,-0.337) (-0.049,-0.400) (0.042,-0.459) (0.135,-0.516) (0.232,-0.570) (0.337,-0.622) (0.452,-0.663) (0.575,-0.680) (0.698,-0.660) (0.808,-0.601) (0.890,-0.504) (0.943,-0.390) (0.979,-0.279) (1.007,-0.179) (1.029,-0.086) (1.049,0.002) (1.068,0.089) (1.086,0.178)};
  \draw[cgray,dashed] plot [smooth,tension=0.55] coordinates {(1.116,0.178) (1.136,0.276) (1.158,0.385) (1.184,0.512) (1.215,0.669) (1.256,0.875) (1.141,0.974) (1.005,1.039) (0.873,1.102) (0.741,1.163) (0.584,1.101) (0.452,1.016) (0.341,0.945) (0.245,0.883) (0.156,0.826) (0.071,0.771) (-0.015,0.716) (-0.103,0.659) (-0.200,0.597) (-0.310,0.526) (-0.443,0.441) (-0.612,0.331) (-0.826,0.178) (-0.741,0.006) (-0.555,-0.118) (-0.408,-0.215) (-0.285,-0.296) (-0.177,-0.367) (-0.078,-0.433) (0.018,-0.496) (0.115,-0.560) (0.215,-0.626) (0.326,-0.699) (0.452,-0.782) (0.601,-0.860) (0.744,-0.819) (0.886,-0.772) (0.956,-0.607) (0.990,-0.443) (1.016,-0.311) (1.039,-0.200) (1.059,-0.100) (1.078,-0.006) (1.097,0.085) (1.116,0.178)};
  \draw[black!60,thin] plot coordinates {(-0.873,0.092) (0.586,-0.871) (0.925,-0.763) (1.266,0.915) (0.708,1.181) (-0.853,0.177) (-0.873,0.092)};
  \draw[cblue,very thick] plot coordinates {(0.231,0.034) (0.051,-0.044) (-0.183,-0.083) (-0.424,-0.055) (-0.620,0.002) (-0.746,0.048) (-0.815,0.074) (-0.847,0.085) (-0.861,0.090)};
  \fill[cblue] (0.231,0.034) circle (1.6pt);
  \fill[cblue] (0.051,-0.044) circle (1.6pt);
  \fill[cblue] (-0.424,-0.055) circle (1.6pt);
  \fill[cblue] (-0.746,0.048) circle (1.6pt);
  \fill[cblue] (-0.847,0.085) circle (1.6pt);
  \fill[cred] (-0.494,-0.037) circle (2.2pt);
  \fill[cred] (-0.8731,0.0917) circle (2pt);
  \node[anchor=north,color=cred] at (-0.8931,-0.0683) {$x^{\star}$};
  \node[anchor=south,color=cblue] at (0.2314,0.1538) {$t{=}1$};
  \node[anchor=south west,color=cred] at (-0.4337,0.0630) {$t{=}10$};
  \draw[cred,dashed] (0.7858,-1.8267) -- (-1.1335,0.8578);
  \node[anchor=west,color=cred,rotate=305.6] at (-1.1335,0.8578) {$c^{\top}x = c^{\top}x^{\star}(10)$};
  \draw[->,color=black!60] (-1.9,0) -- (2.0,0) node[below] {$x_1$};
  \draw[->,color=black!60] (0,-1.7) -- (0,1.9) node[left] {$x_2$};
\end{tikzpicture}
中心路径上的对偶点
由中心性条件可以导出中心路径的一个重要性质:每个中心点都产生一个对偶可行点,从而给出最优值
可以断言
首先,由于
可见
(取
特别地,与
即
例子(不等式形式 LP 续):不等式形式 LP 的对偶为
由中心性条件显然
对偶可行,其对偶目标值为
通过 KKT 条件来理解
中心路径条件也可以解释为 KKT 最优性条件的连续变形。点
它与 KKT 条件的唯一差别在于:互补性条件
力场解释
中心路径还有一个简单的力学解释:把严格可行集
把每个约束关联一个力:当粒子位于
约束产生的总力场的势就是对数障碍
再设想粒子受到另一个力
该“目标力场”把粒子拉向负梯度方向,即朝
中心点
例子(不等式形式 LP 续):LP 第
它指向约束超平面
换言之,每个约束超平面都有一个大小与到该超平面的距离成反比的排斥力。
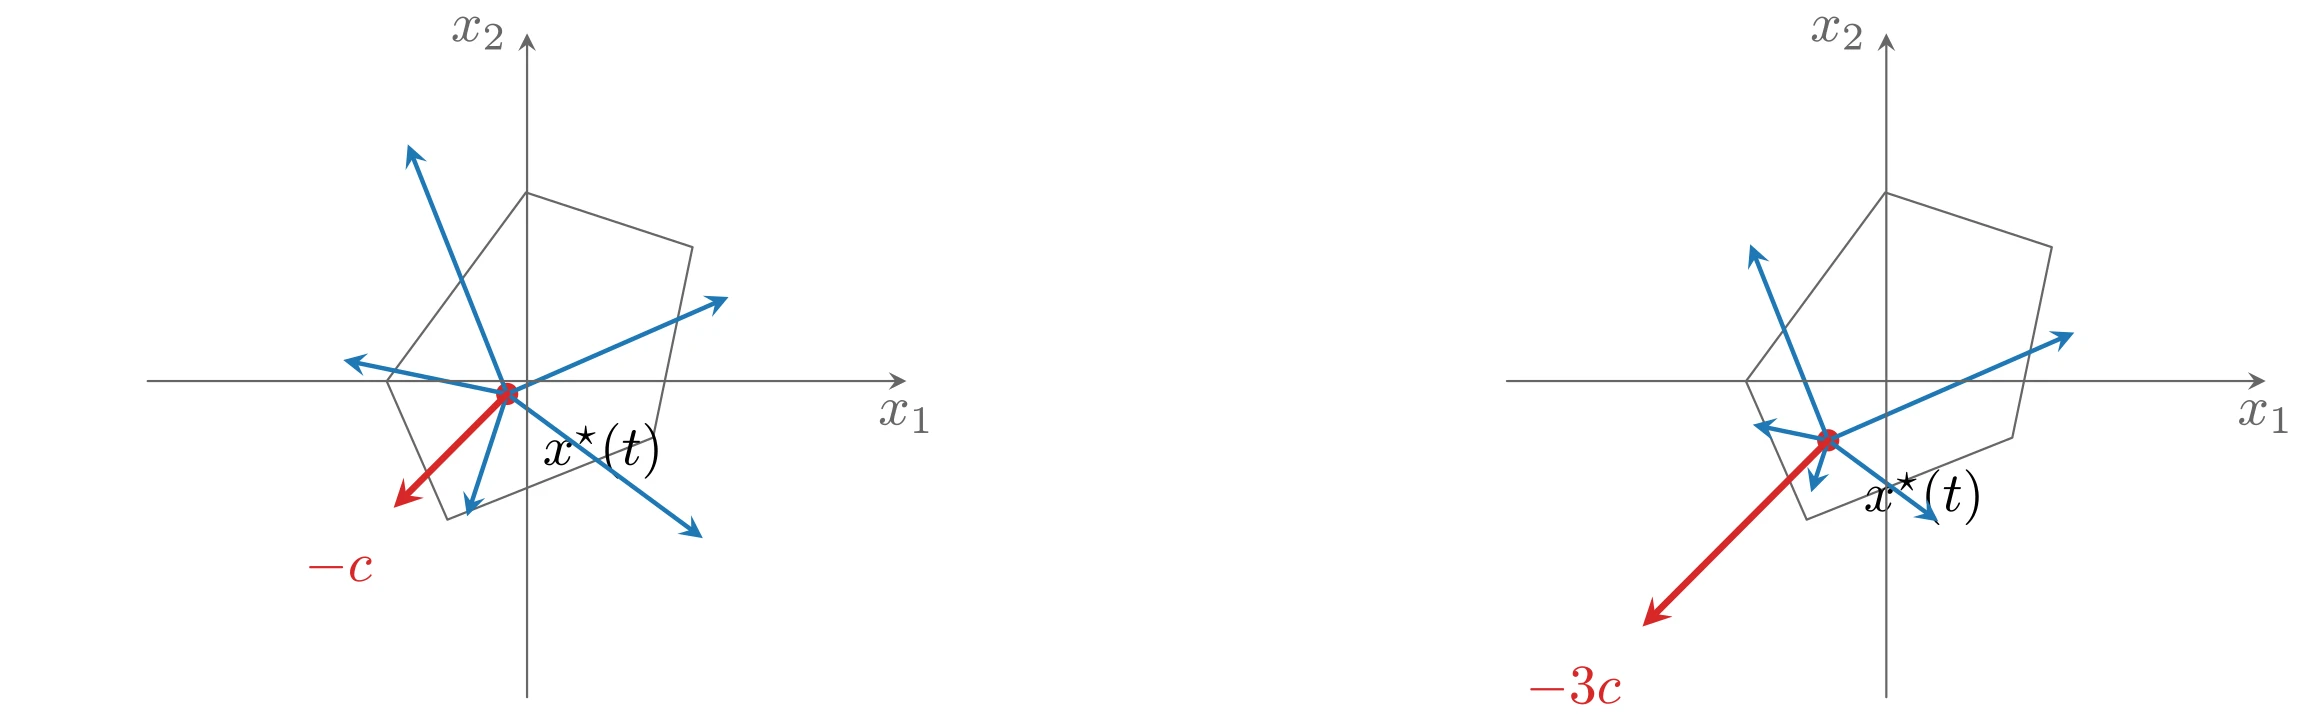
上图由下面的 TikZ 代码编译而来:
  \definecolor{cblue}{RGB}{31,119,180}
  \definecolor{cred}{RGB}{214,39,40}
  \definecolor{cgreen}{RGB}{44,160,44}
  \definecolor{corange}{RGB}{255,127,14}
  \definecolor{cpurple}{RGB}{148,103,189}
  \definecolor{cbrown}{RGB}{140,86,75}
  \definecolor{cpink}{RGB}{227,119,194}
  \definecolor{cgray}{RGB}{127,127,127}
\begin{tikzpicture}[x=1cm,y=1cm,>=stealth,line cap=round,line join=round]
  \begin{scope}[xshift=0cm]
  \draw[black!60,thin] plot coordinates {(-0.888,-0.001) (-0.504,-0.877) (0.797,-0.358) (1.047,0.847) (-0.007,1.193) (-0.888,-0.001)};
    \fill[cred] (-0.1258,-0.0817) circle (2pt);
    \node[anchor=north west] at (-0.0258,-0.1417) {$x^{\star}(t)$};
    \draw[->,cblue,thick] (-0.1258,-0.0817) -- (-1.1633,0.1331);
    \draw[->,cblue,thick] (-0.1258,-0.0817) -- (-0.3798,-0.8560);
    \draw[->,cblue,thick] (-0.1258,-0.0817) -- (1.1122,-0.9945);
    \draw[->,cblue,thick] (-0.1258,-0.0817) -- (1.2747,0.5314);
    \draw[->,cblue,thick] (-0.1258,-0.0817) -- (-0.7547,1.4977);
    \draw[->,cred,very thick] (-0.1258,-0.0817) -- (-0.8441,-0.8022) node[anchor=north east] at (-0.8441,-0.9222) {$-c$};
    \draw[->,color=black!60] (-2.4,0) -- (2.4,0) node[below] {$x_1$};
    \draw[->,color=black!60] (0,-2.0) -- (0,2.2) node[left] {$x_2$};
  \end{scope}
  \begin{scope}[xshift=8.6cm]
  \draw[black!60,thin] plot coordinates {(-0.888,-0.001) (-0.504,-0.877) (0.797,-0.358) (1.047,0.847) (-0.007,1.193) (-0.888,-0.001)};
    \fill[cred] (-0.3677,-0.3749) circle (2pt);
    \node[anchor=north west] at (-0.2677,-0.4349) {$x^{\star}(t)$};
    \draw[->,cblue,thick] (-0.3677,-0.3749) -- (-0.8451,-0.2761);
    \draw[->,cblue,thick] (-0.3677,-0.3749) -- (-0.4756,-0.7038);
    \draw[->,cblue,thick] (-0.3677,-0.3749) -- (0.3291,-0.8887);
    \draw[->,cblue,thick] (-0.3677,-0.3749) -- (1.1896,0.3069);
    \draw[->,cblue,thick] (-0.3677,-0.3749) -- (-0.8615,0.8654);
    \draw[->,cred,very thick] (-0.3677,-0.3749) -- (-1.5426,-1.5534) node[anchor=north east] at (-1.5426,-1.6734) {$-3c$};
    \draw[->,color=black!60] (-2.4,0) -- (2.4,0) node[below] {$x_1$};
    \draw[->,color=black!60] (0,-2.0) -- (0,2.2) node[left] {$x_2$};
  \end{scope}
\end{tikzpicture}